Home » Blog » Legal Search Patterns Across America: A Data-Driven Analysis
Legal Search Patterns Across America: A Data-Driven Analysis
Explore U.S. legal search behavior trends, discover regional keyword volumes, popular practice areas, and opportunities for targeted local SEO.
I hope you enjoy reading this blog post. Click Here for Marketing Audit
Author
Shamil Shamilov
Founder of dNOVO Group
Millions of Americans still turn to search engines like Google to find legal services. There are certain problems that can only be resolved with the help of a professional lawyer. Where there is high demand, there is intense competition. So, it’s no surprise that marketing competition in the legal industry is intoxicatingly strong. In fact, the average Google Ads Cost per Click (CPC) is $6.75 for the legal industry – some of the highest among all sectors. Adding to this, CPCs can spiral to over $50 in certain locations and specialisms.
This presents several painful issues (and opportunities) for law firms. On the one hand, advertisers can end up sinking more revenue into paid marketing. If it goes well, they’ll reap the rewards, but all too often, it results in a poor return.
To compound issues, people with genuine legal needs don’t get the best help they need, instead ending up with the attorneys who have the deepest pockets to compete in this saturated market.
But there is good news. Deep market studies paired with the right marketing strategies can give law firms a window into the public’s legal troubles and serve their needs in the right place at the right time.
That’s why dNovo has taken this data-driven approach to produce this report that analyses the search behavior and legal struggles of the American public. In the course of our study, we’ve created a ‘legal needs map’ that provides unseen insights for service providers, policymakers, and researchers.
Key Findings
The report covers an extensive study of the legal search patterns from 40 major US cities. It reveals a distinctive variation in regional needs and issues. The search data was compiled using the top 30 legal specialties and combined with population data to normalize the comparisons. The results are eye-opening, exposing unique stories about the challenges Americans face.
Here’s what the key findings include:
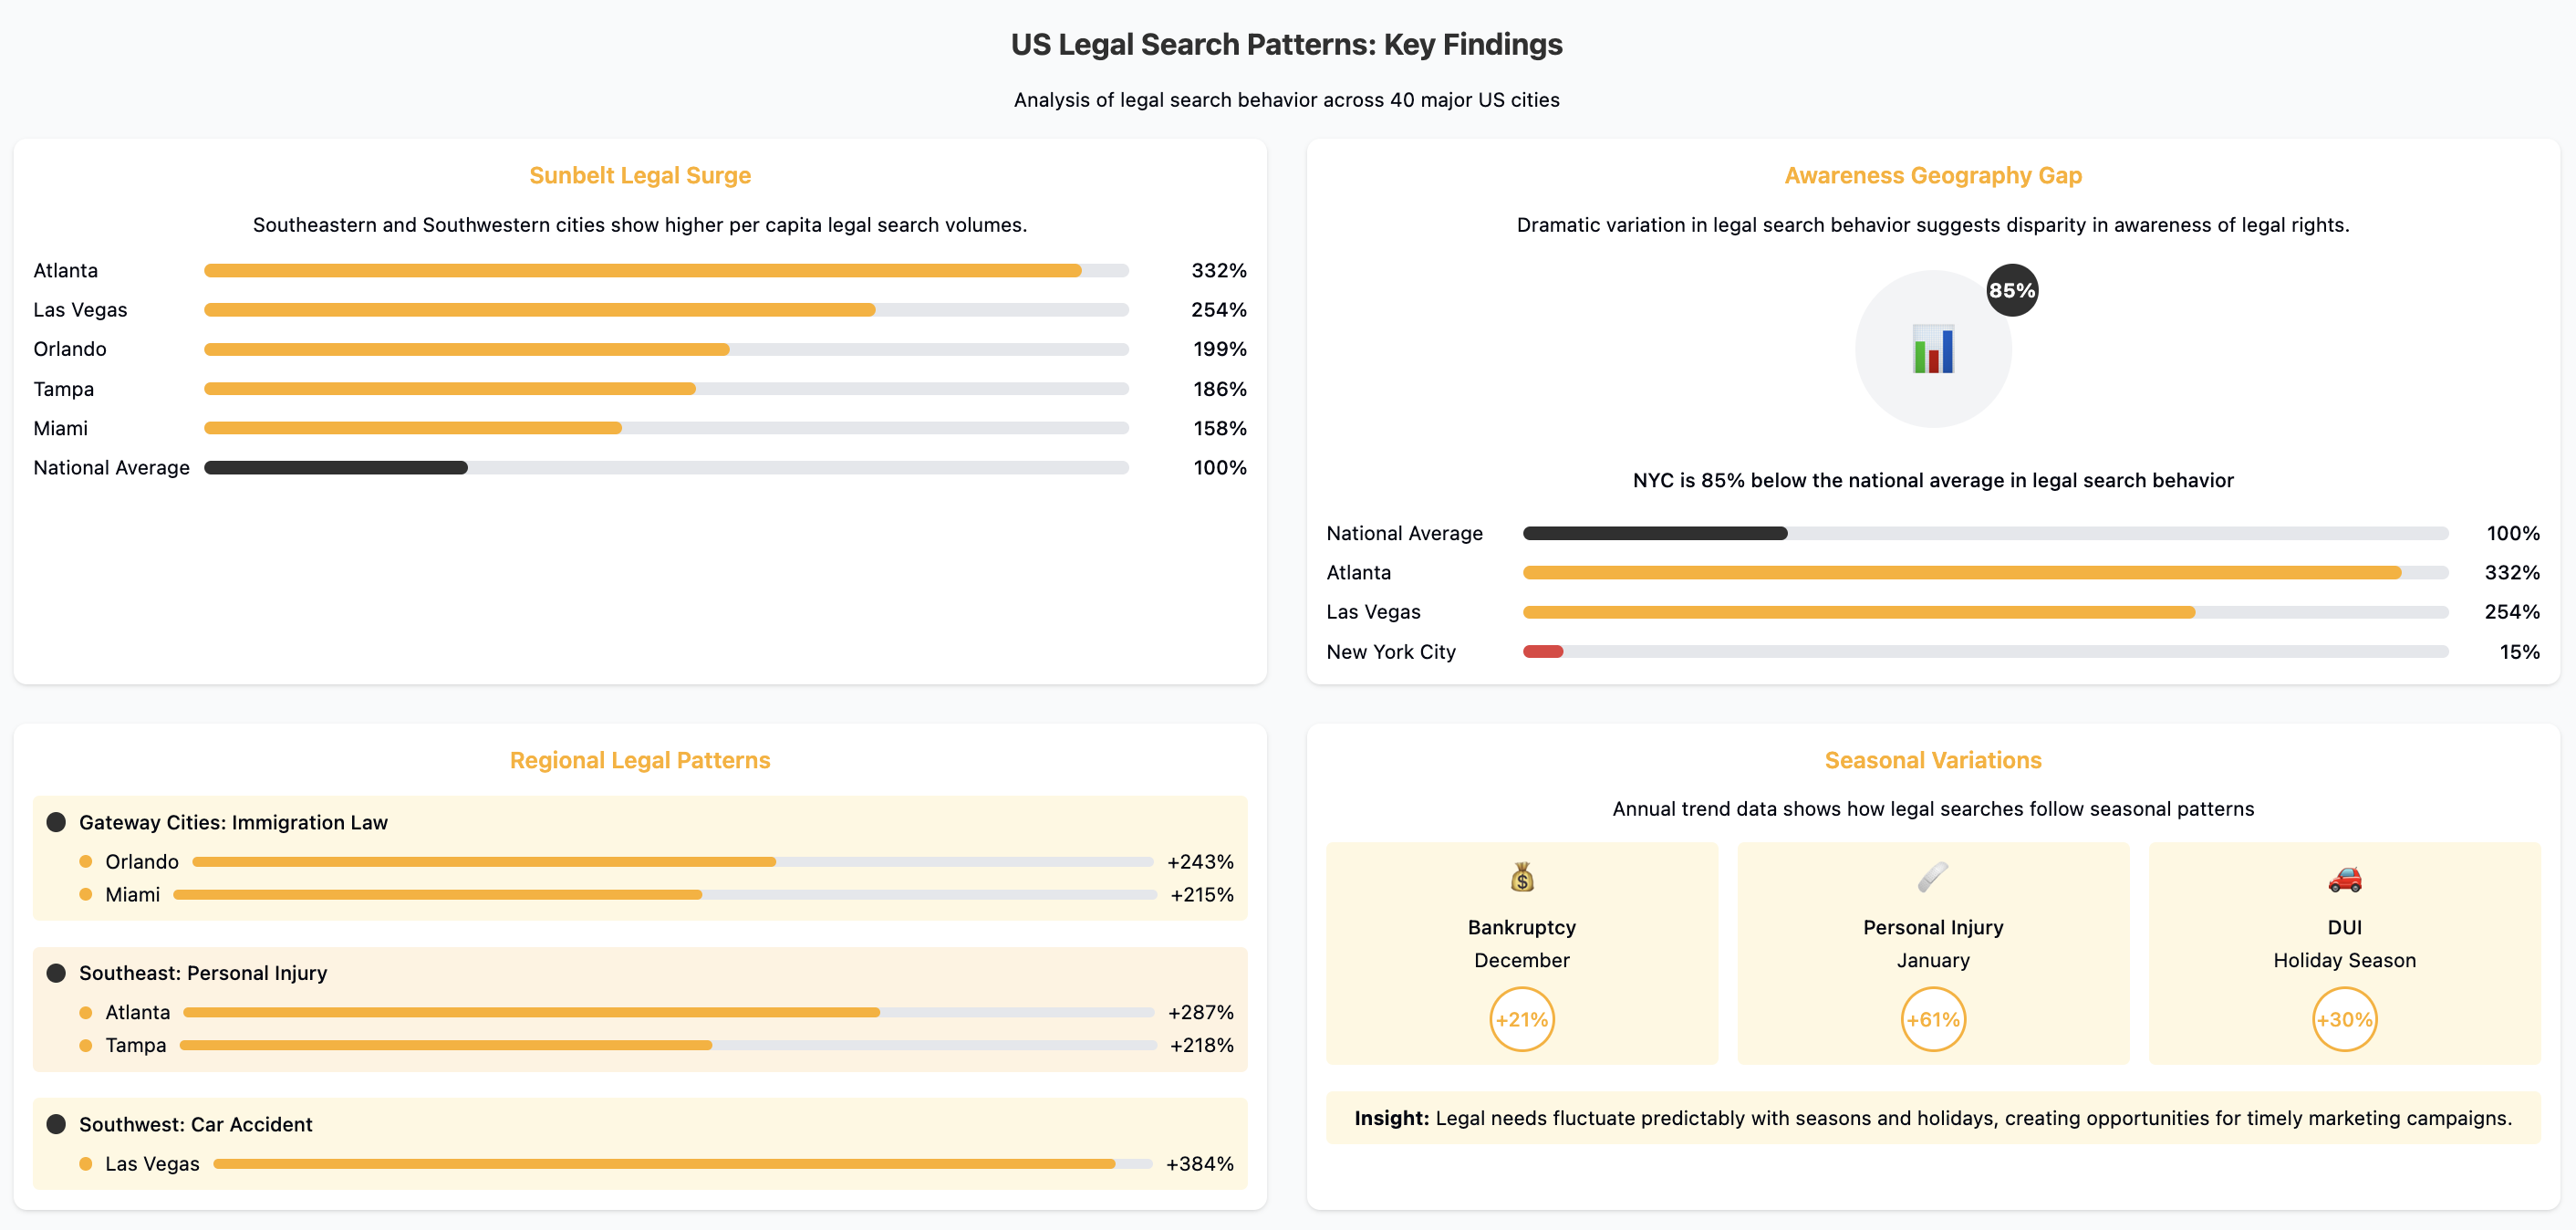
A Sunbelt Legal Surge: Southeastern and Southwestern cities show higher per capita legal search volumes. Atlanta (+332%), Las Vegas (+254%), Orlando (+199%), Tampa (+186%), and Miami (+158%) lead in legal search intensity.
Regional Legal Patterns: Immigration law searches are abundant in gateway cities like Orlando and Miami. In Atlanta and Tampa, personal injury searches are soaring. For Las Vegas, there’s a distinct +384% spike of interest in car accident representation.
Seasonal Variations: Annual trend data on how legal searches follow seasonal swings. Bankruptcy searches increase 21% in December, personal injury 61% in January, and DUI escalates 30% during the holiday season.
Awareness Geography Gap: One of the most interesting findings is the dramatic variation in legal search behavior across regions. It suggests a disparity in awareness of legal rights, needs, and access, particularly in the most densely populated areas like New York City which is 85% below the national average.
Methodology
Data Collection
For the analysis, we collected Google search volume data for 30 top lawyer specialties, such as “personal injury lawyer” and “immigration lawyer,” across 40 major US cities. This is delivered in 1200 localized legal specialty keyword combinations for the base of the data collection.
For each keyword combination, the following data points were collected using SEMRush:
Monthly search volume
Keyword difficulty (competition)
Cost-per-click data
12-month trend data
Population Normalization
To normalize the data for fair analysis, population data was used with the following formula:
Searches per 100,000 residents = (Search Volume ÷ City Population) × 100,000
This ensured that patterns reflect genuine variations rather than being influenced by population size.
America’s Legal Search Landscape
Overall Legal Search Intensity
From a top-level view, the results reveal patterns across wider regions of the country. South East and South West areas show dramatically more intense legal requests compared to Northern and Mid-East cities. It shows locations where people are more likely to look for legal help to solve disputes and issues.
The top 10 cities by legal searches per 100,000 residents are:
Atlanta, GA: 4,076 searches
Las Vegas, NV: 3,313 searches
Orlando, FL: 2,770 searches
Tampa, FL: 2,649 searches
Miami, FL: 2,227 searches
Pittsburgh, PA: 1,907 searches
Denver, CO: 1,641 searches
New Orleans, LA: 1,605 searches
Houston, TX: 1,471 searches
Austin, TX: 1,372 searches
In contrast, the cities with the lowest legal search intensity include:
New York, NY: 132 searches per 100K residents
Columbus, OH: 260 searches per 100K residents
Washington, DC: 276 searches per 100K residents
St. Louis, MO: 297 searches per 100K residents
Oklahoma City, OK: 321 searches per 100K residents
Sunbelt Legal Surge
Five of the top 10 cities for legal search intensity are in the Southeast. Florida alone is home to three of the top five positions. It highlights one of the most significant patterns in the data.
Several factors may be the cause of this finding:
Tourism Economies: Cities with high tourism, like Las Vegas, Orlando, and Miami, offer higher legal search volume, a possible reflection of representation for accidents, DUIs, and other incidents from tourists.
Population Growth: These Sunbelt cities continue to experience rapid population growth. This is potentially leading to increased demand from new residents who are looking for new services in the area.
Demographic Factors: Population age, unique immigration patterns, and similar demographic factors in these states could be swaying legal requirements.
Metropolitan vs Mid-Sized Cities
An unexpected finding is that the most densely populated areas showed lower per capita search volume. Surprisingly, New York ranks bottom for this legal search intensity, while Chicago and Los Angeles also fell in the lower rankings.
Residents of mid-sized cities show a clear tendency to look for legal help relative to their population density. Atlanta, Orlando, and Las Vegas came in high in results, showing a pattern for legal needs or search behavior doesn’t scale with population size.
Legal Specialty Analysis
With national and regional patterns identified for overarching search intensity, the data could then be segmented further into legal specialties. This quickly revealed district-regional legal requirements and the type of legal issues Americans are facing.
Personal Injury Law
Across the nation, personal injury law searches were the highest of any legal specialist, with 72,190 total monthly searches across all cities. However, there were large regional variations in legal requests identified.
The top 5 cities for personal injury lawyer searches per 100,000 residents are:
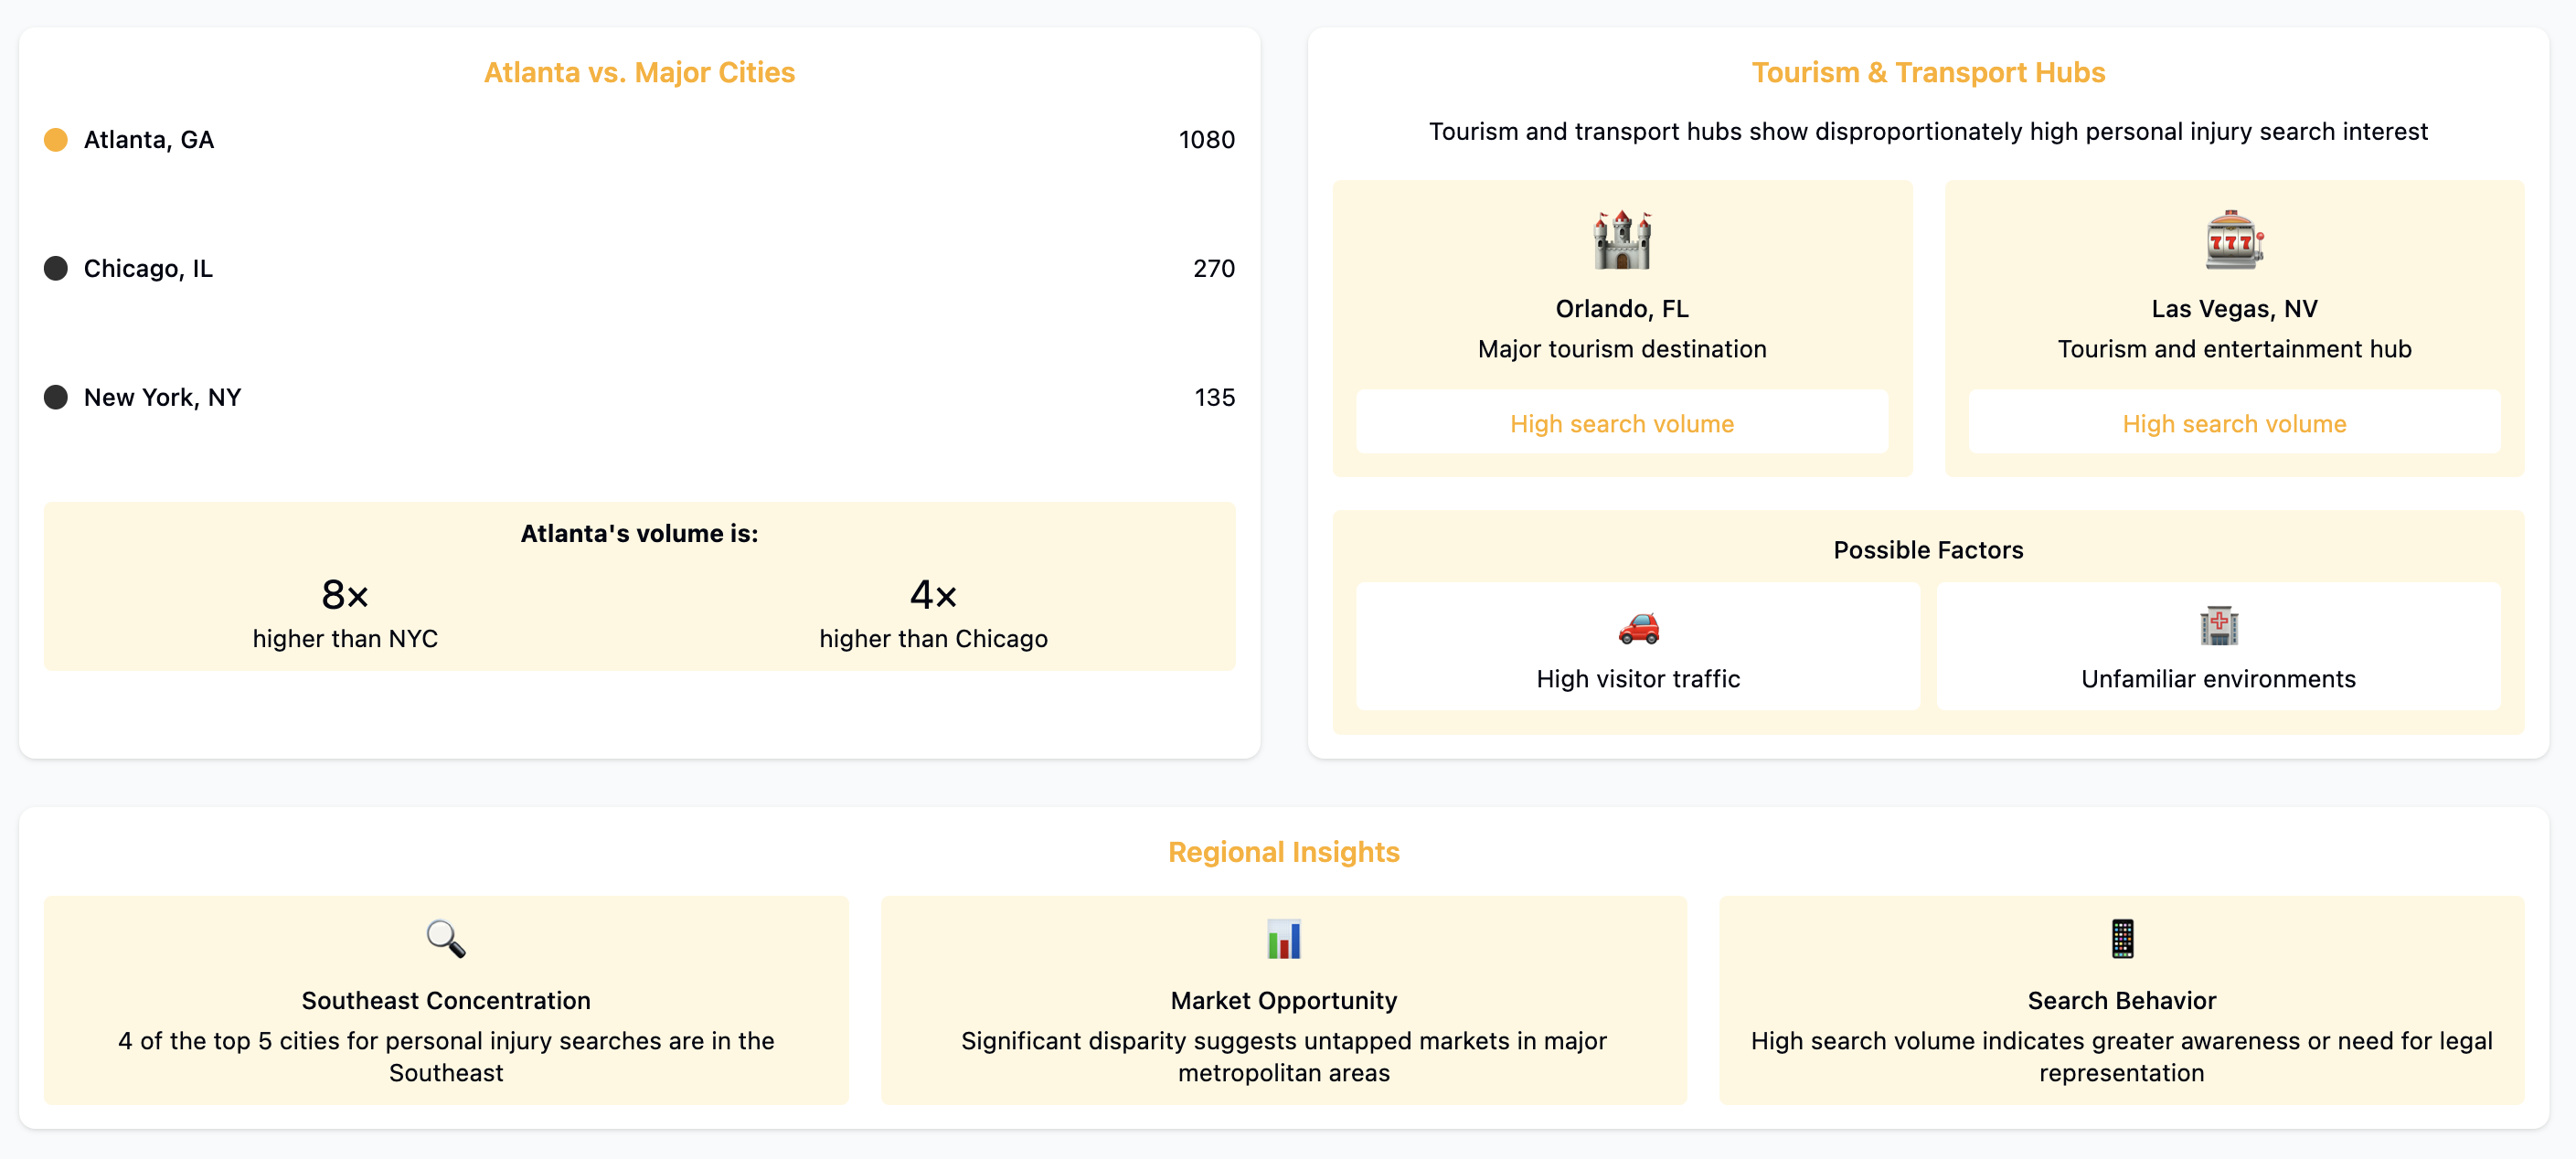
Atlanta, GA: 1,080 searches
Tampa, FL: 615 searches
Pittsburgh, PA: 533 searches
Orlando, FL: 433 searches
Nashville, TN: 433 searches
It’s a striking result for the South East concentration. Atlanta’s personal injury legal search volume is almost 8 times that of New York and 4 times higher than Chicago.
In addition to this, tourism and transport hubs, like Orlando and Las Vegas, show a disproportionately high personal injury search interest.
Immigration Law
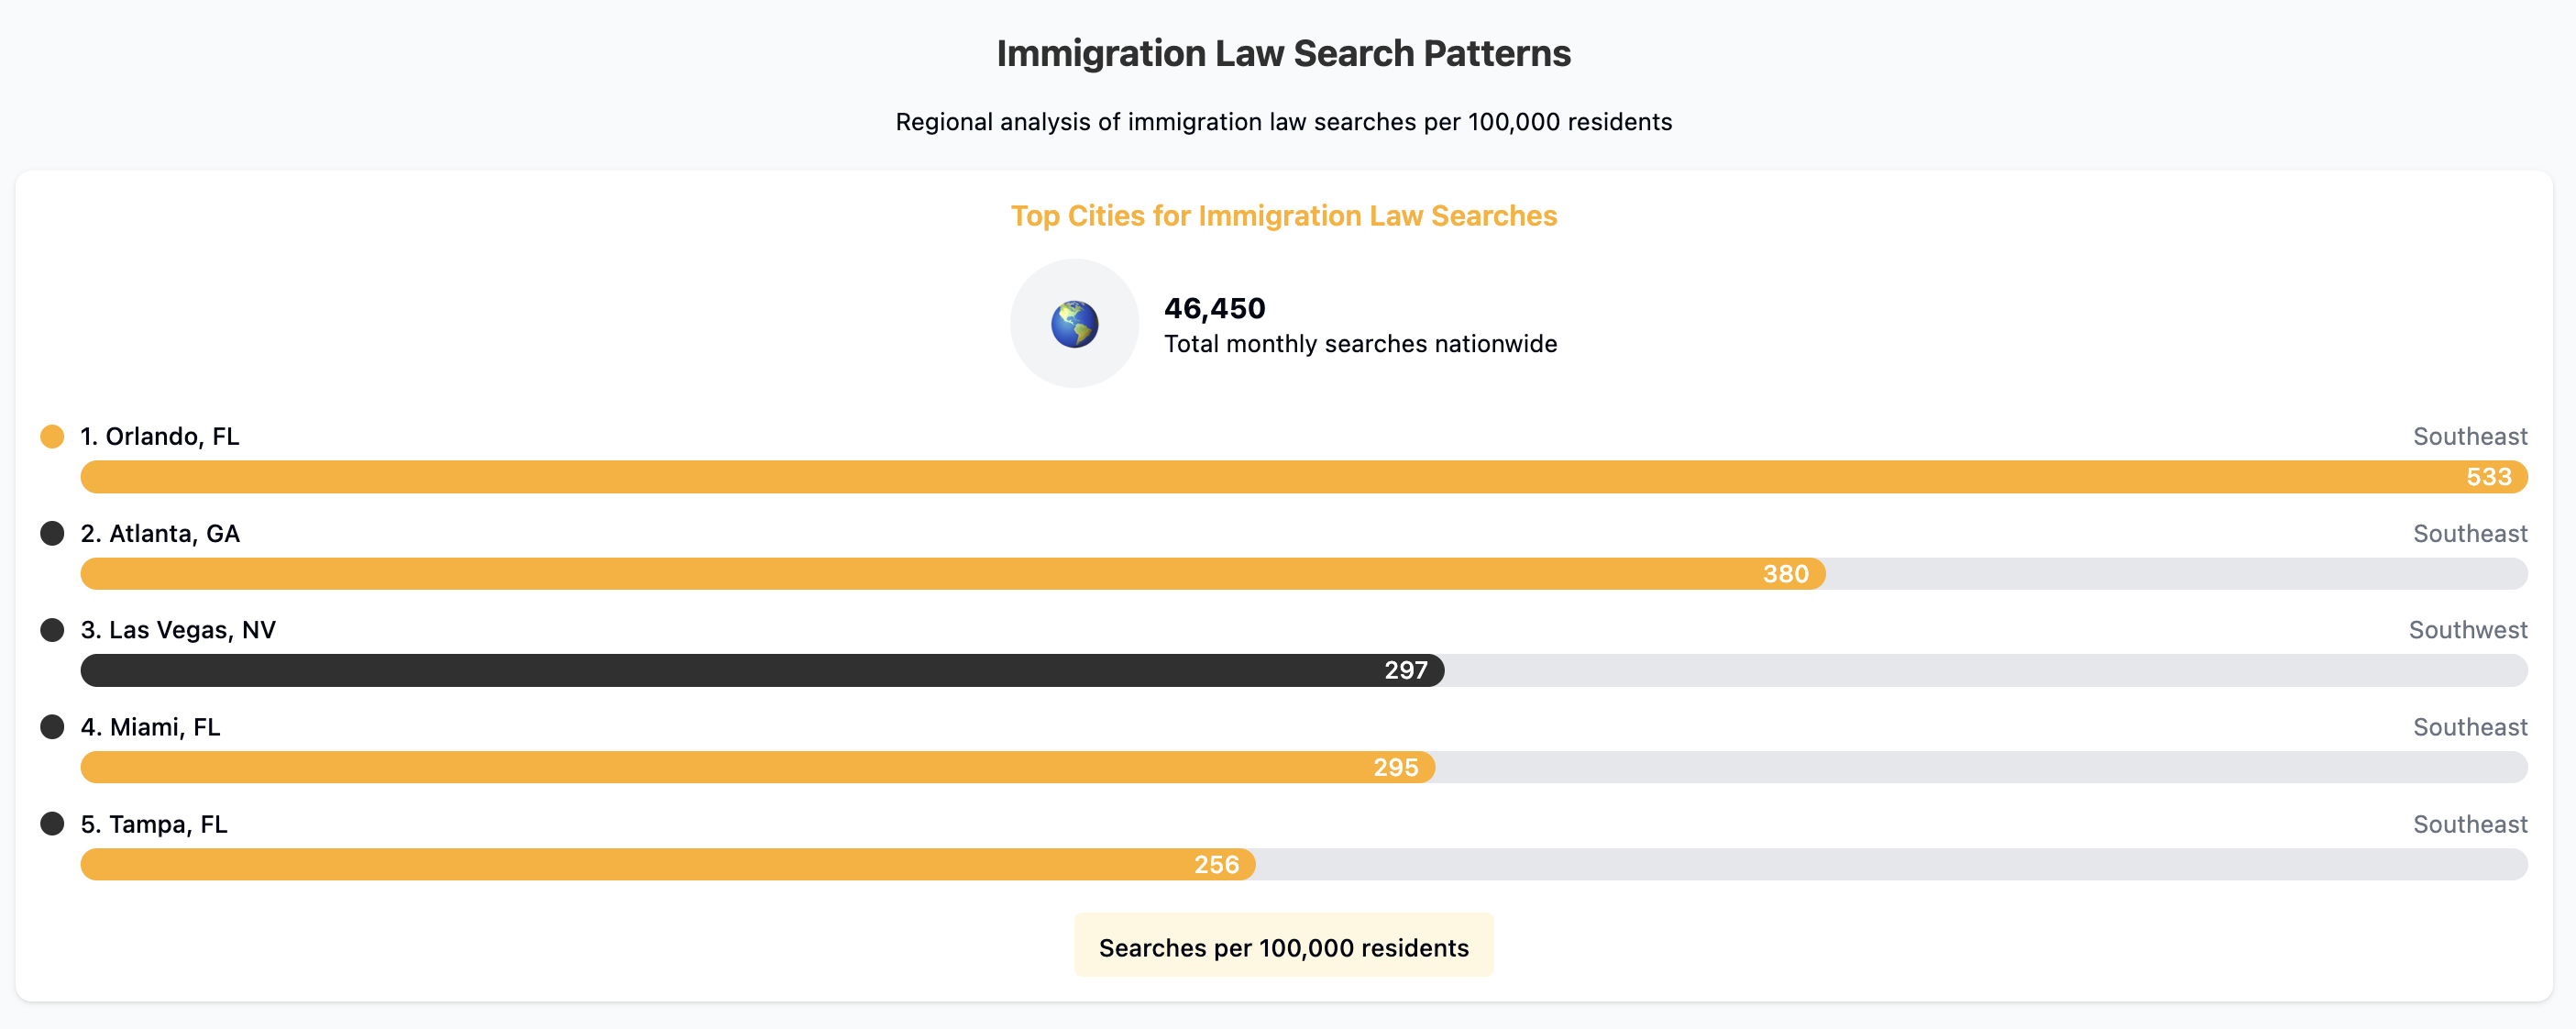
Immigration law searches have a high volume of 46,450 total searches. Regionally, the results were largely as expected.
The top 5 cities for immigration lawyer searches per 100,000 residents are:
Orlando, FL: 533 searches
Atlanta, GA: 380 searches
Las Vegas, NV: 297 searches
Miami, FL: 295 searches
Tampa, FL: 256 searches
Miami’s high ranking is unsurprising as an immigration gateway, but Orlando’s top position is perhaps more surprising. It might reflect a growing immigrant population from the tourism industry hiring needs. Interestingly, the border state location in Texas shows substantial search interest but is ranked lower than might be expected. Although the report was conducted with English language keywords, this could skew the accuracy of results.
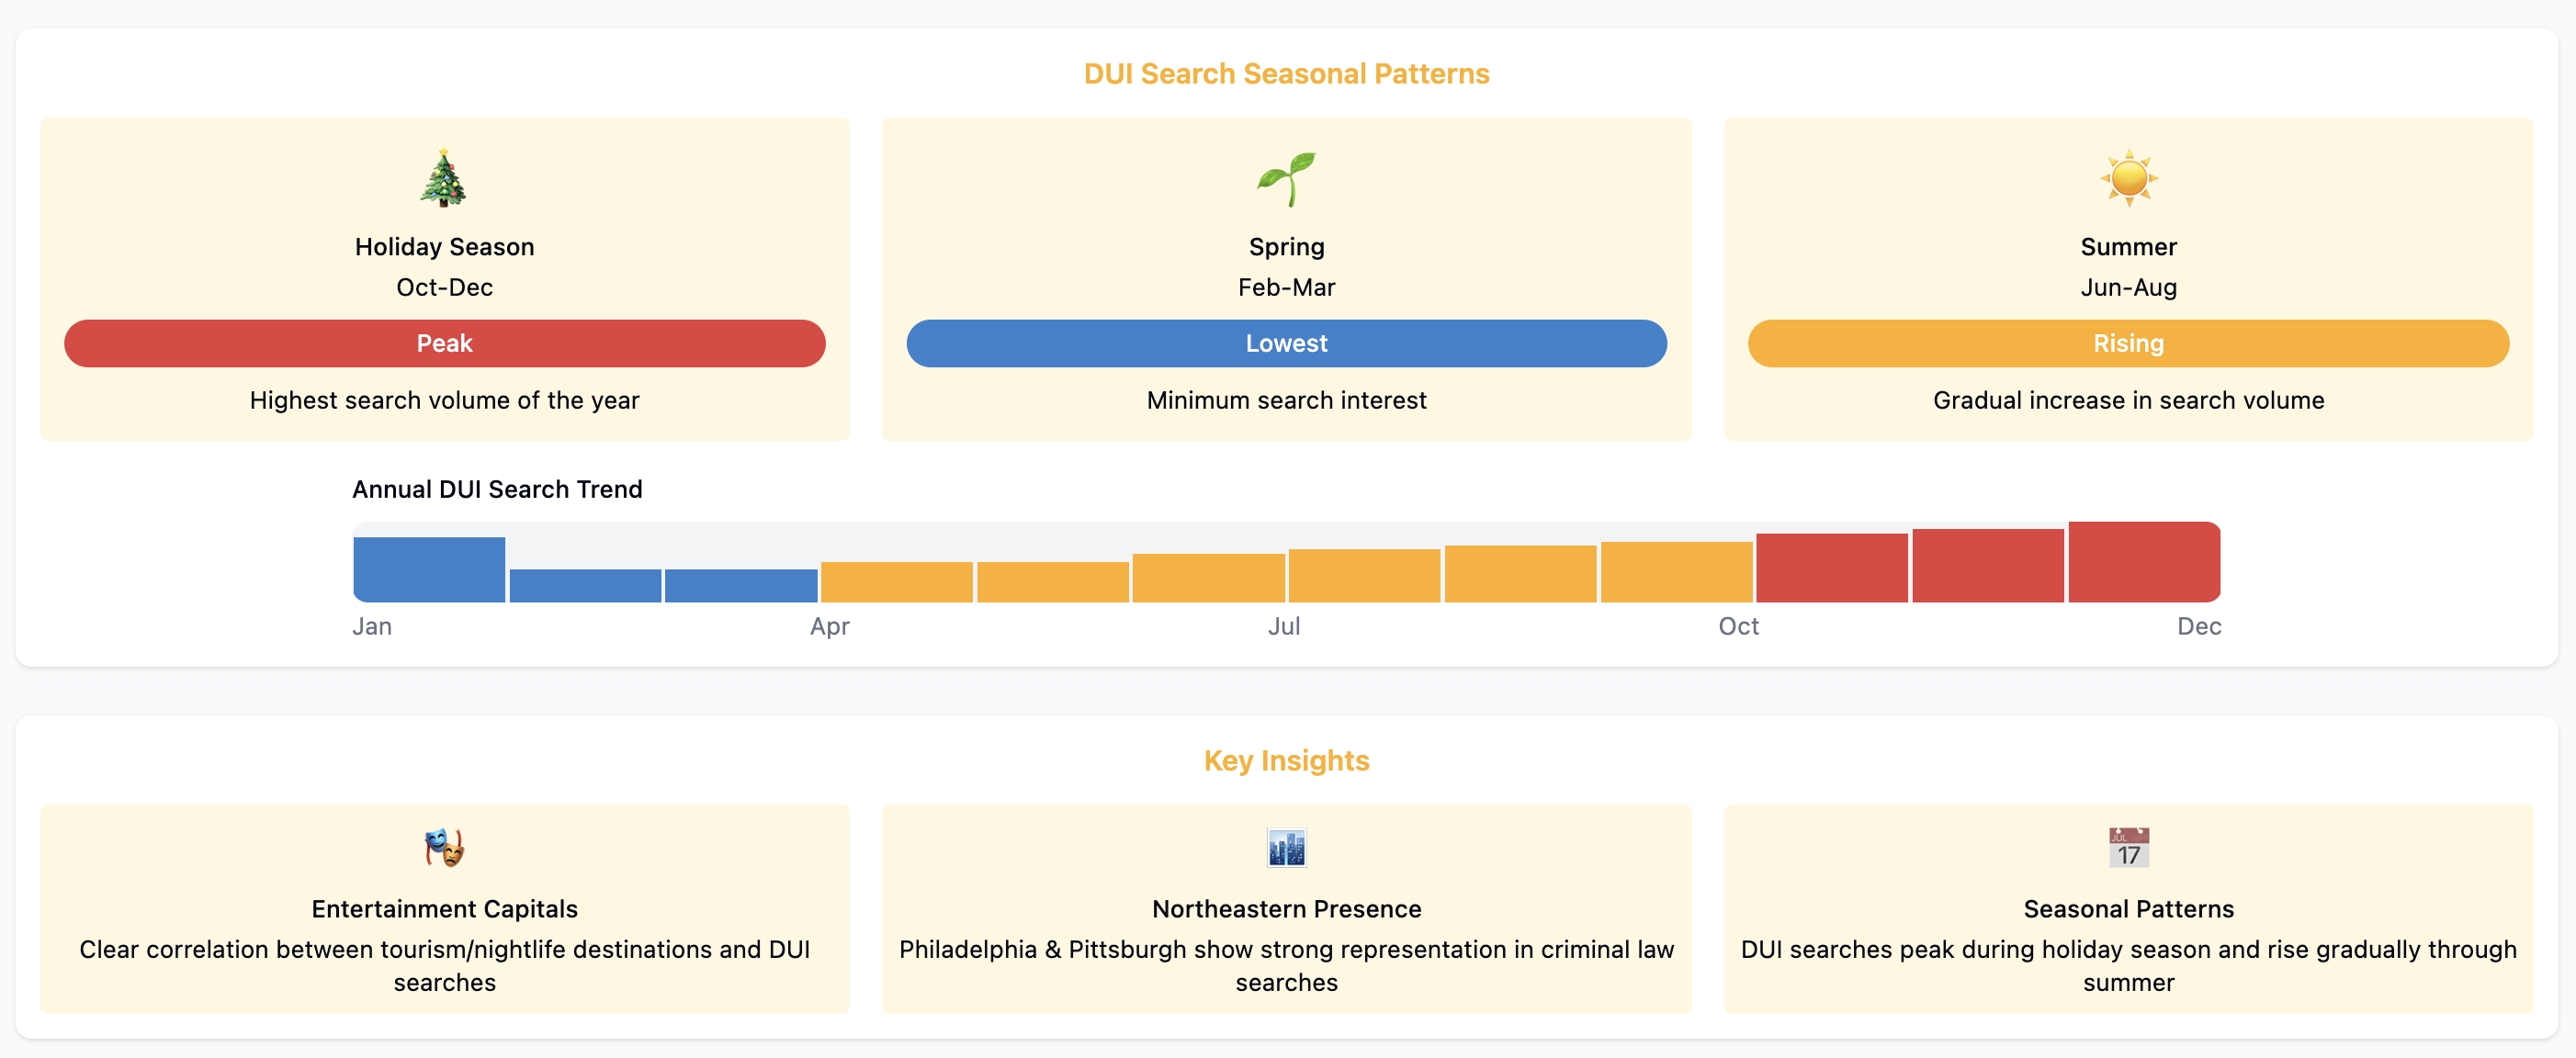
Criminal Law & DUI
Criminal law and DUI searches offered clear regional patterns, too. Entertainment capitals lead the way with notably high search volumes.
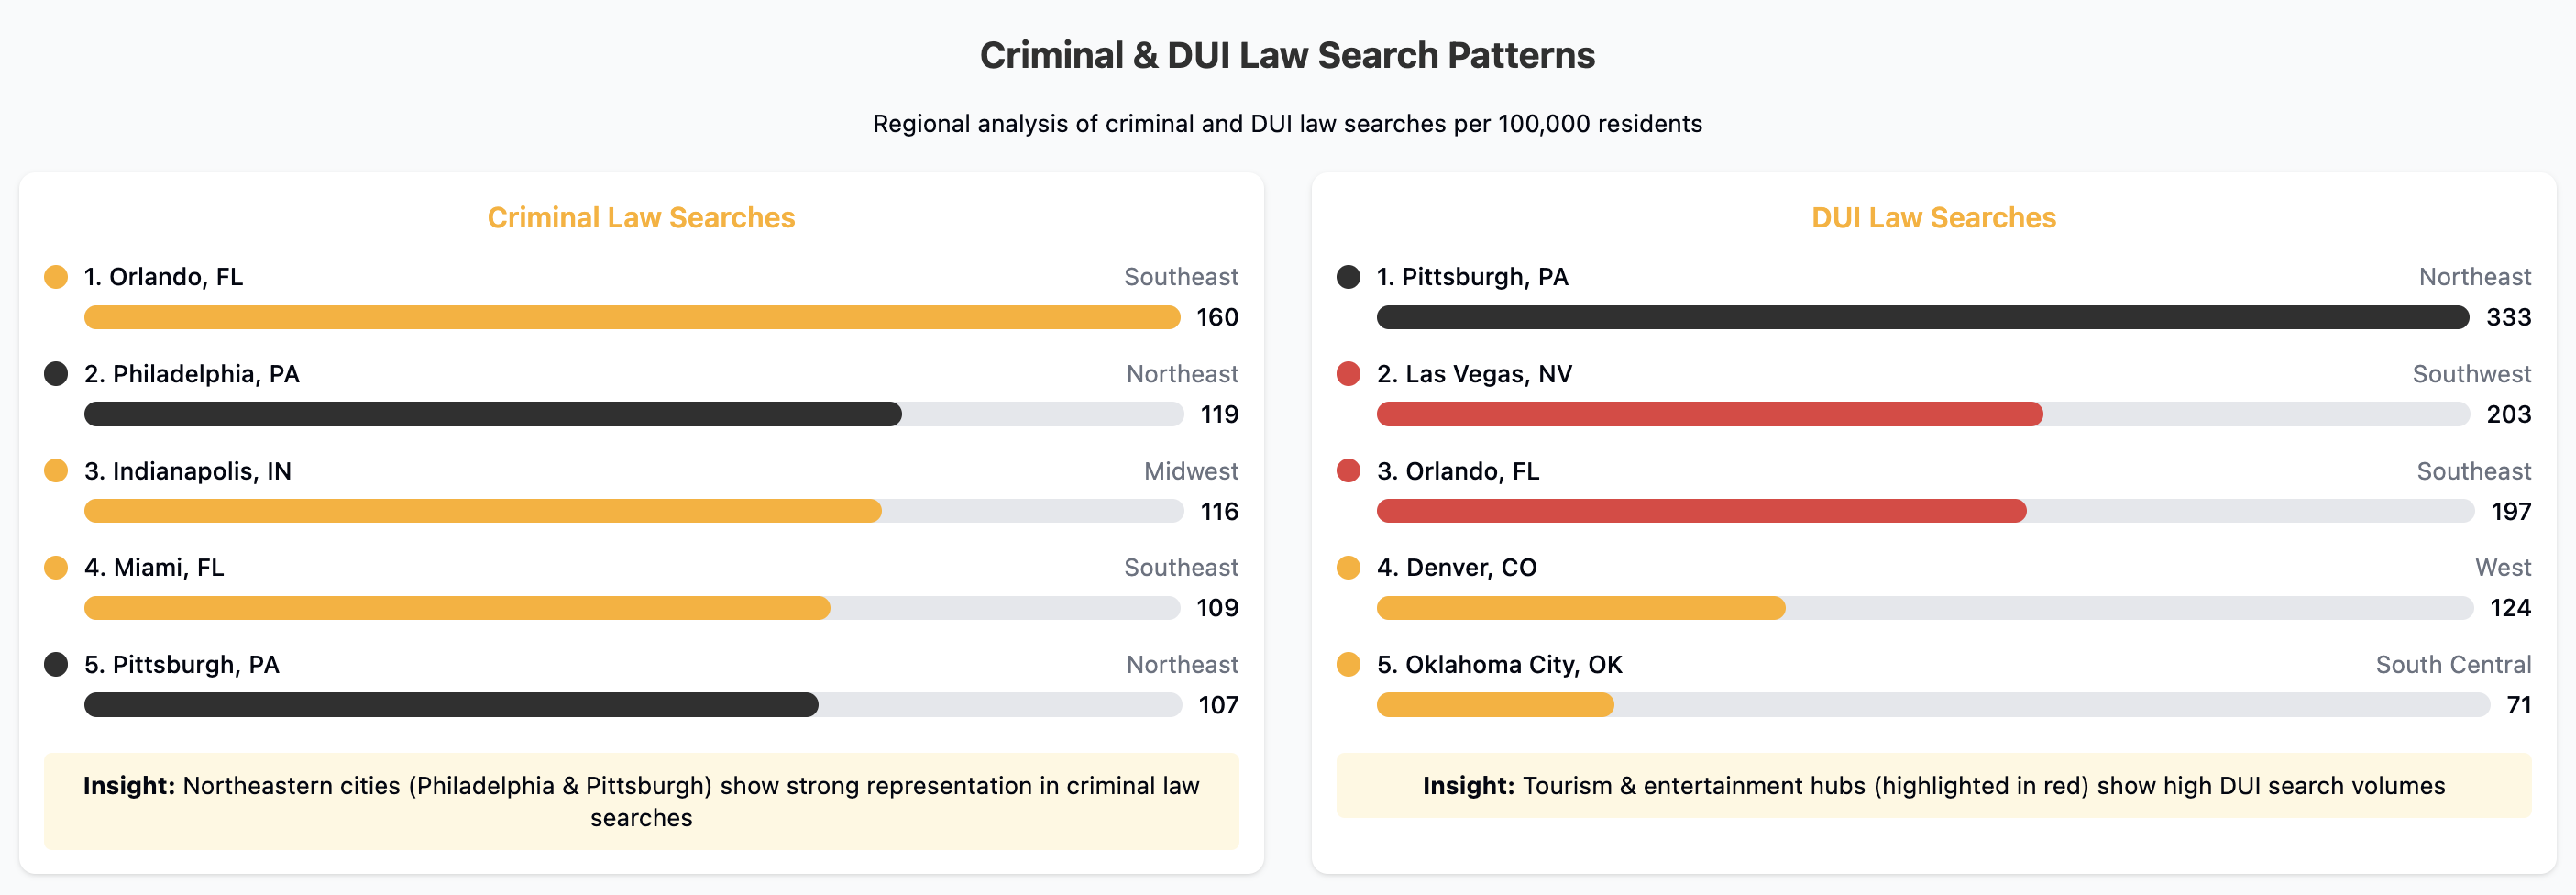
The top 5 cities for criminal lawyer searches per 100,000 residents are:
Orlando, FL: 160 searches
Philadelphia, PA: 119 searches
Indianapolis, IN: 116 searches
Miami, FL: 109 searches
Pittsburgh, PA: 107 searches
For DUI lawyer searches, the leaders are:
Pittsburgh, PA: 333 searches
Las Vegas, NV: 203 searches
Orlando, FL: 197 searches
Denver, CO: 124 searches
Oklahoma City, OK: 71 searches
A correlation between destinations like Las Vegas and Orlando and DUI searches points to a connection between tourism and nightlife requirements.
Philadelphia and Pittsburgh show Northeastern representation, with both ranking in the top 5 for criminal law searches. This is an interesting contrast with their lower rankings in immigration law.
Seasonal patterns were reflected clearly in DUI searches:
Holiday Season Peak: October through December shows the highest search volume
Spring Low: February and March show minimum search interest
Gradual Summer Rise: Search volume increases throughout the summer months
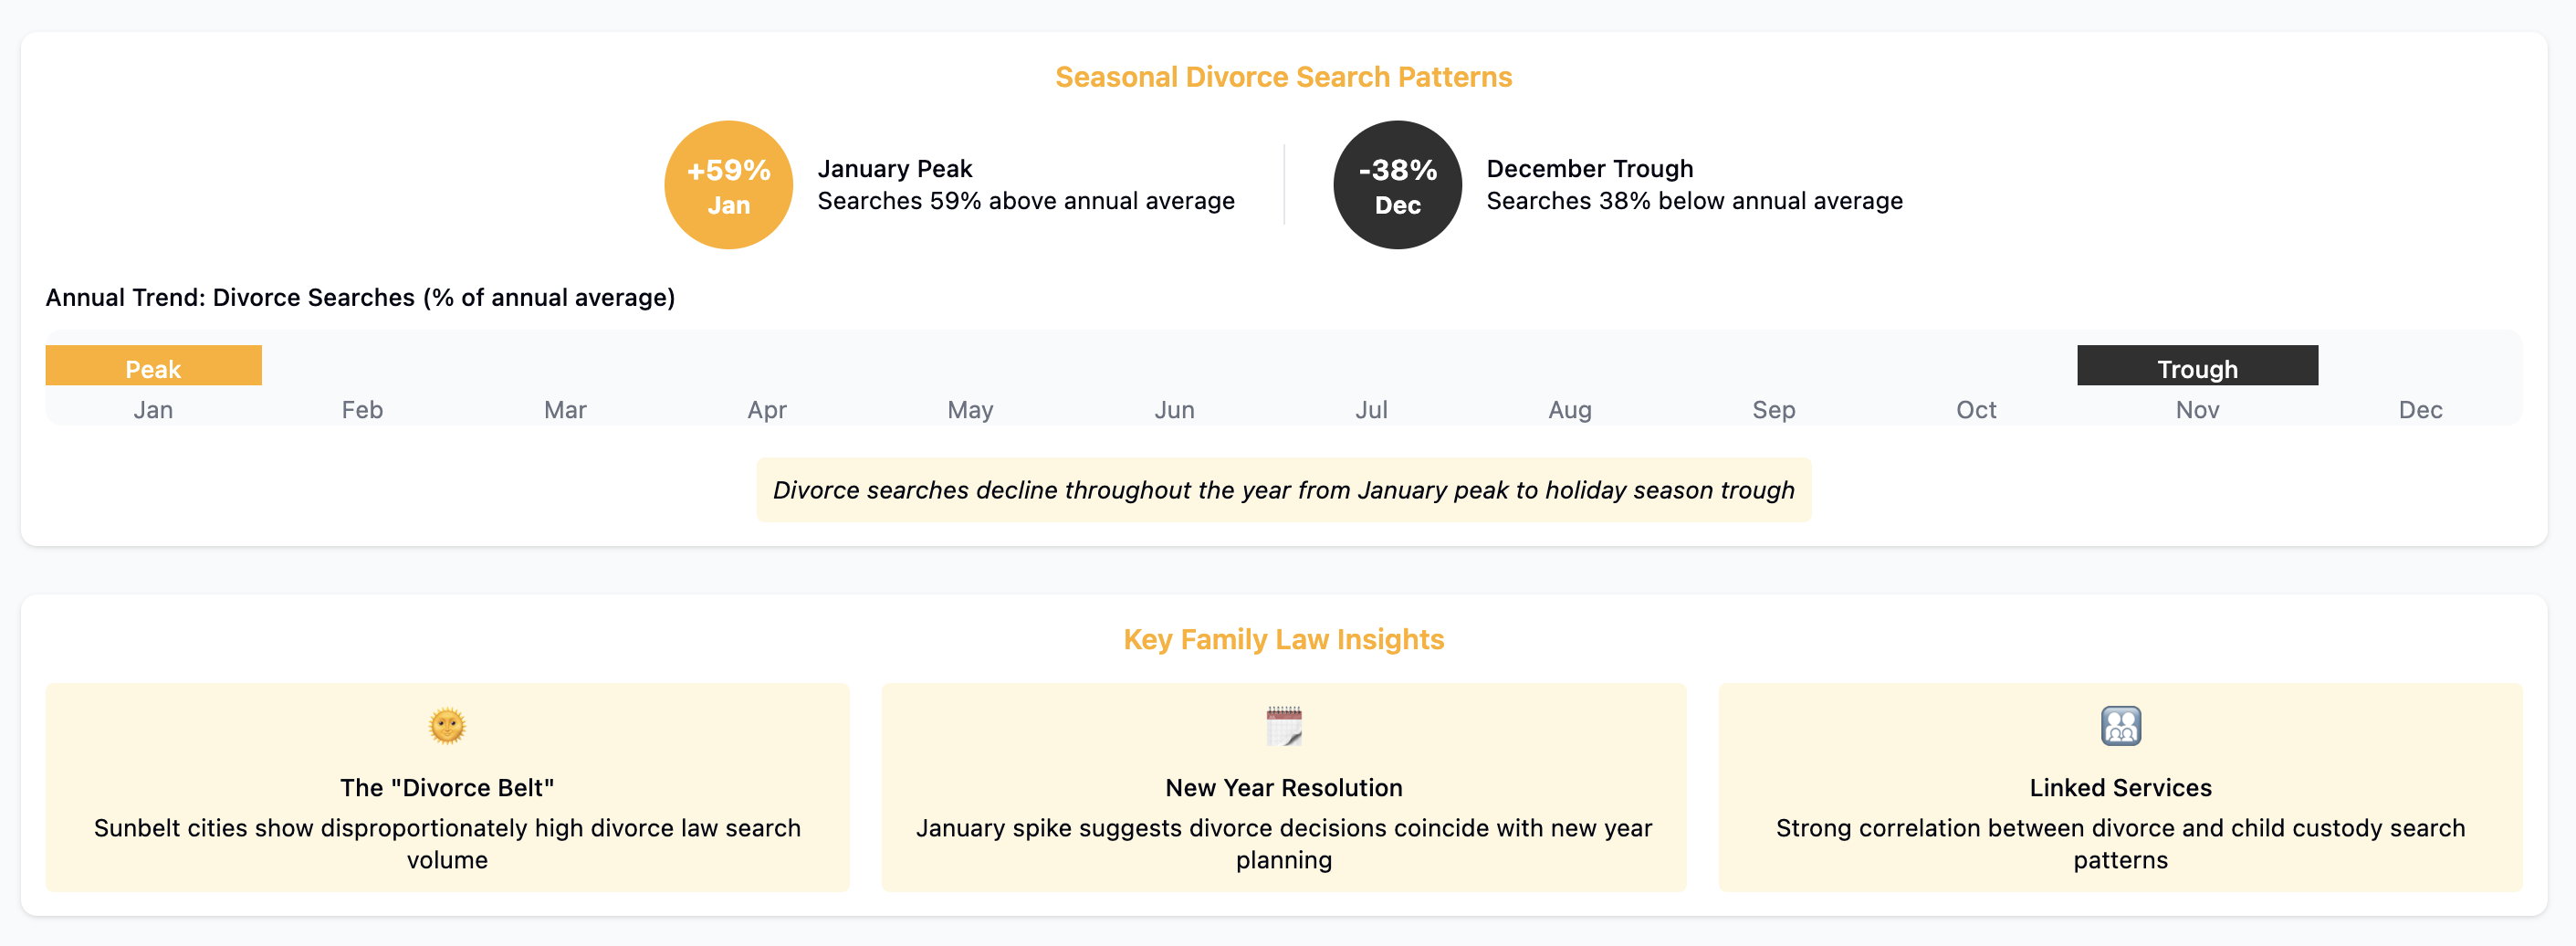
Family Law (Divorce & Child Custody)
Several sunbelt cities could also be referred to as the “Divorce Belt”, with search data revealing requirements for family law support. Atlanta, Phoenix, and Charlotte have divorce law in their top 3 legal search types. A potential connection between regional divorce-related needs and awareness?
The top 5 cities for divorce lawyer searches per 100,000 residents are:
Atlanta, GA: 260 searches
Austin, TX: 168 searches
Pittsburgh, PA: 160 searches
Albuquerque, NM: 157 searches
Tucson, AZ: 133 searches
There was also a noticeable overlap between high divorce and child custody searches. This suggests these legal needs often occur simultaneously.
Interestingly, divorce searches have a clear seasonal trend pattern across all regions. January is the peak, with searches 59% above the annual average, while the trend declines through the year until a trough in November and December.
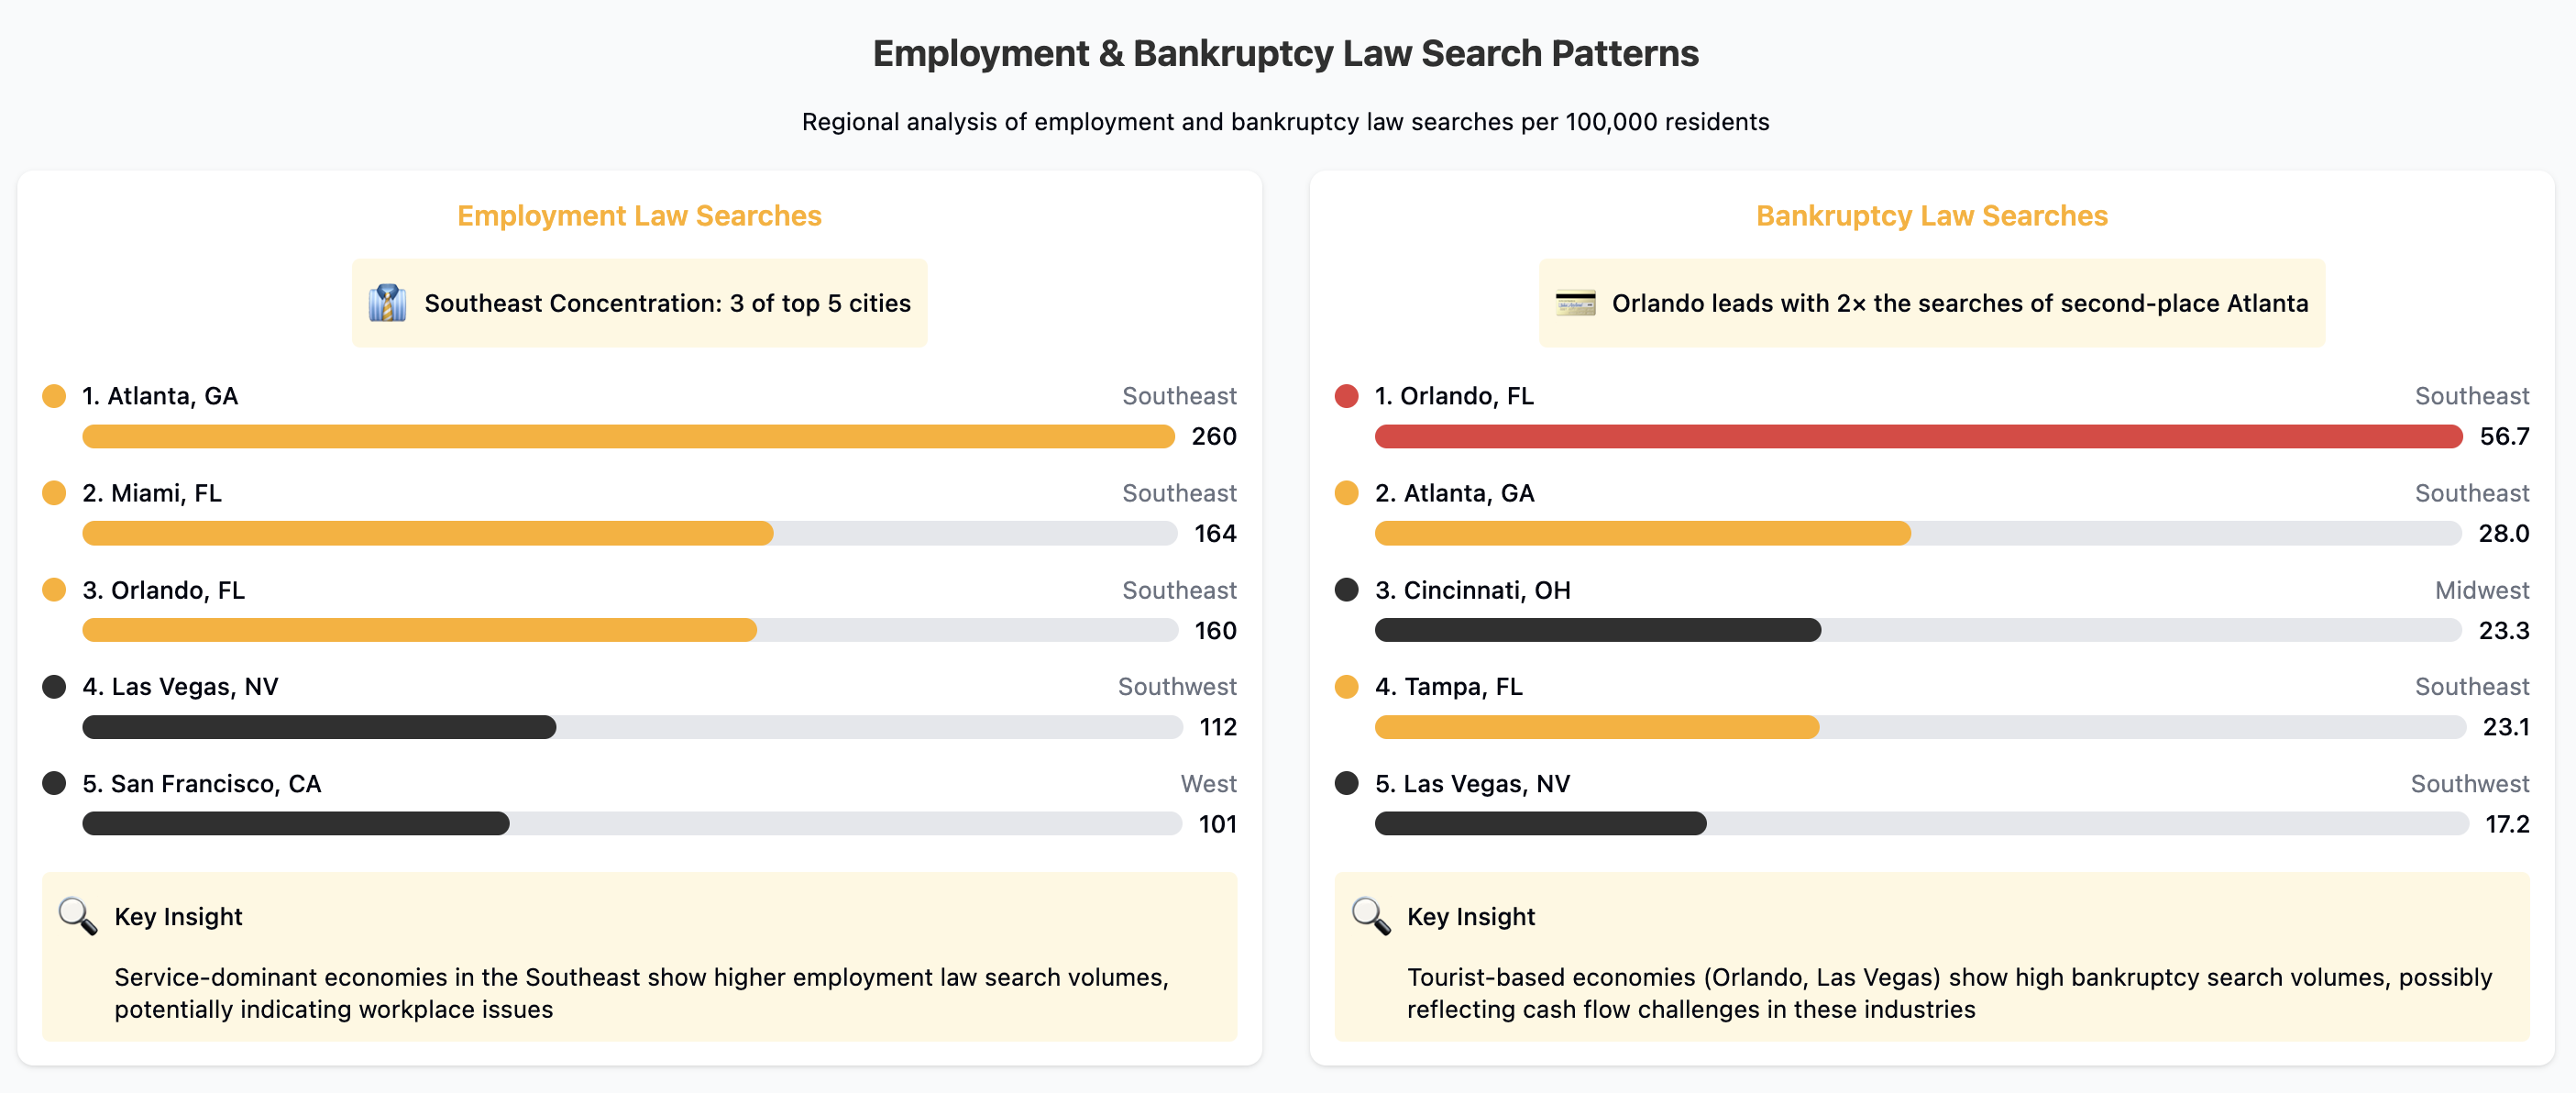
Employment & Business Law
A noteworthy data point is a Southeastern concentration of searches related to workplace and right-to-work laws. This is reflected in three of the top five rankings. This could point to employment problems with businesses in service-dominant economies.
The top 5 cities for employment lawyer searches per 100,000 residents are:
Atlanta, GA: 260 searches
Miami, FL: 164 searches
Orlando, FL: 160 searches
Las Vegas, NV: 112 searches
San Francisco, CA: 101 searches
Bankruptcy Law
Bankruptcy law searches indicate potential regional patterns. Orlando’s legal requirements extend into bankruptcy searches, which are more than twice that of second-place Atlanta. Again, tourist-based economies often sit high on the list. Could this be a reflection of the fluctuating demand and cash flow challenges of the tourism industry?
The top 5 cities for bankruptcy lawyer searches per 100,000 residents are:
Orlando, FL: 56.7 searches
Atlanta, GA: 28.0 searches
Cincinnati, OH: 23.3 searches
Tampa, FL: 23.1 searches
Las Vegas, NV: 17.2 searches
Deeper Seasonal Legal Patterns
Across the nation, there are distinct seasonal patterns that show how legal needs change through the year. The patterns help to identify annual struggles related to holidays, weather, and financial requirements.
Personal Injury Law: Peaks in January and October, with summer lows in July and August.
Immigration Law: Generally highest in November and September
Criminal Law: Show peaks in February and January
DUI Law: Significant spikes in October through to December
Divorce Law: A clear January spike that dissipates through the year.
Bankruptcy Law: Growing to boiling point in December, then slumping to September lows
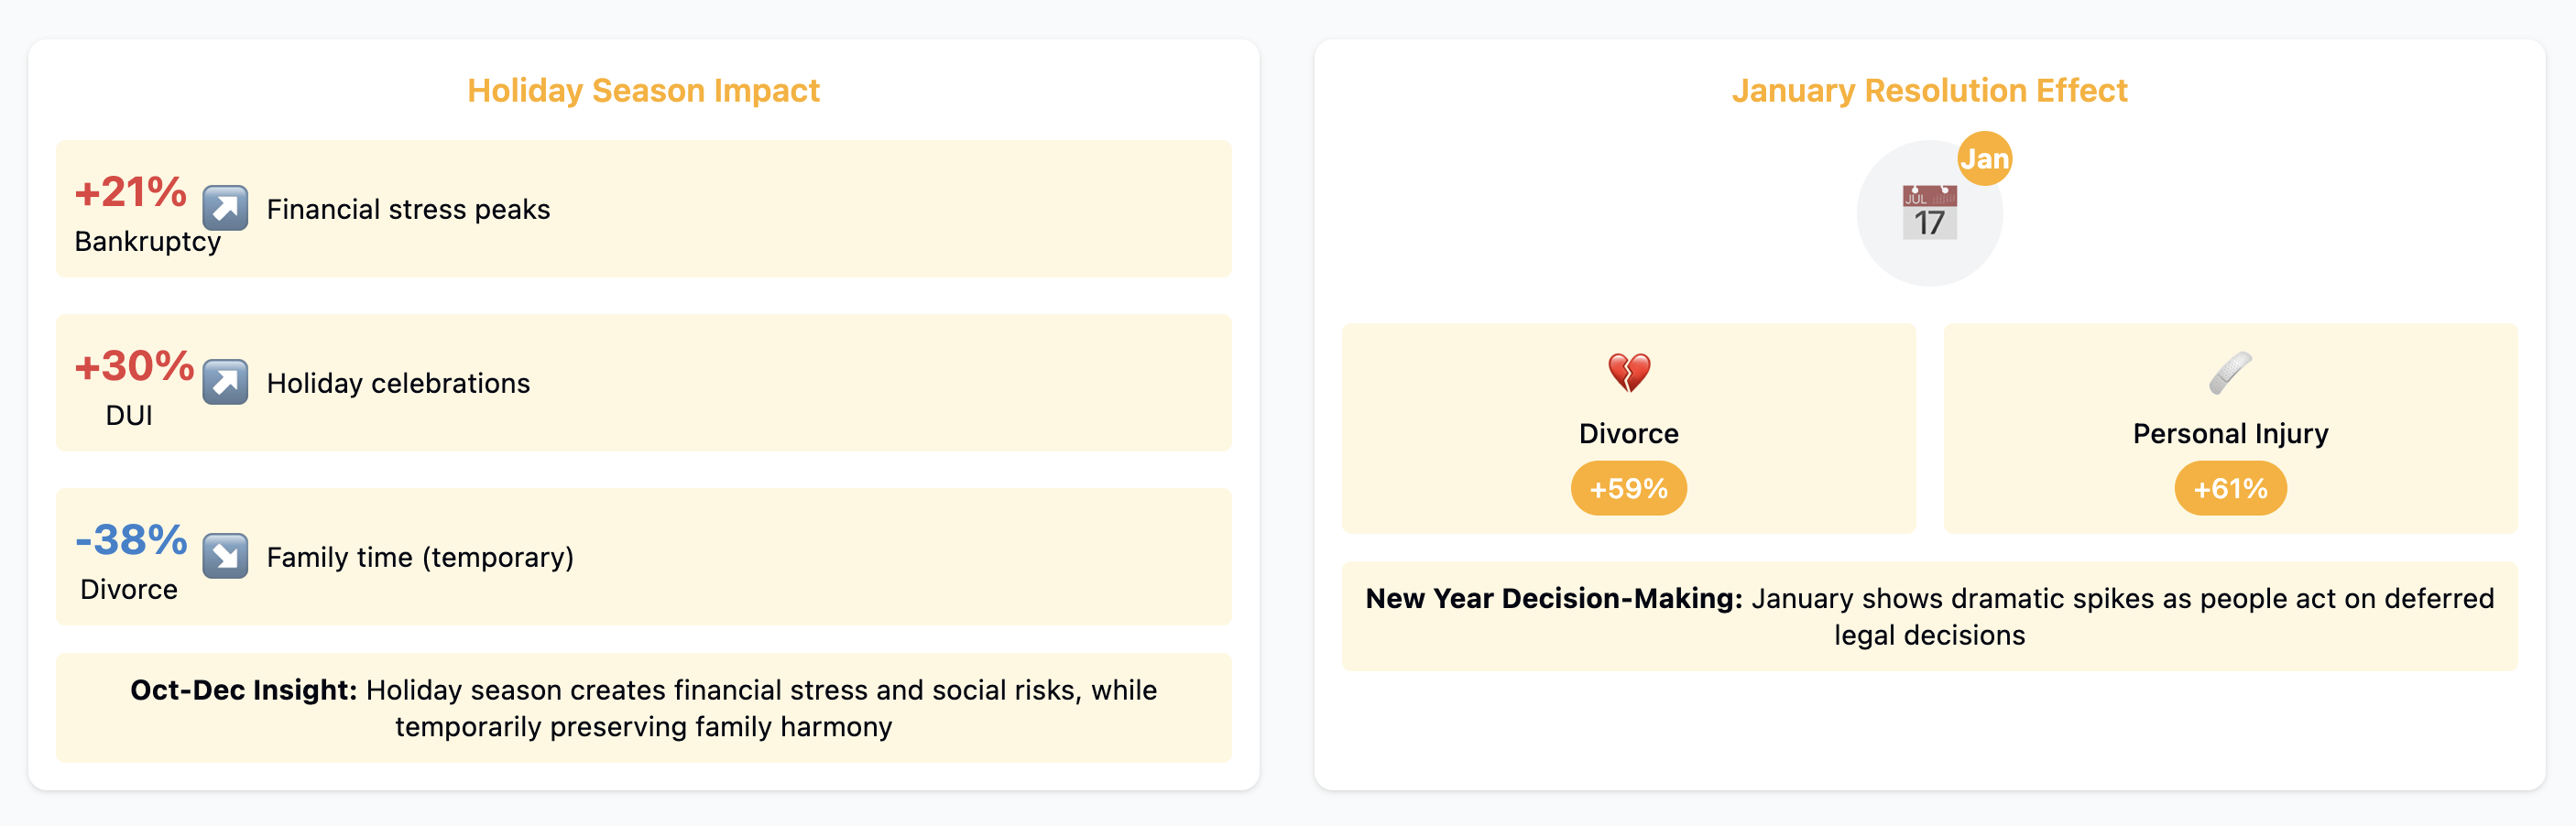
The winter holiday season shows a particular set of stresses people face related to finance, social engagements, and family.
Increased Bankruptcy Searches: December shows peak bankruptcy search interest
DUI Search Surge: DUI searches rise aggressively from October throughout December
Reduced Divorce Searches: Divorce searches reach their annual low point as families come together, although this is short-lived when January arrives for a huge search spike.
Conclusion: Insights and Implications
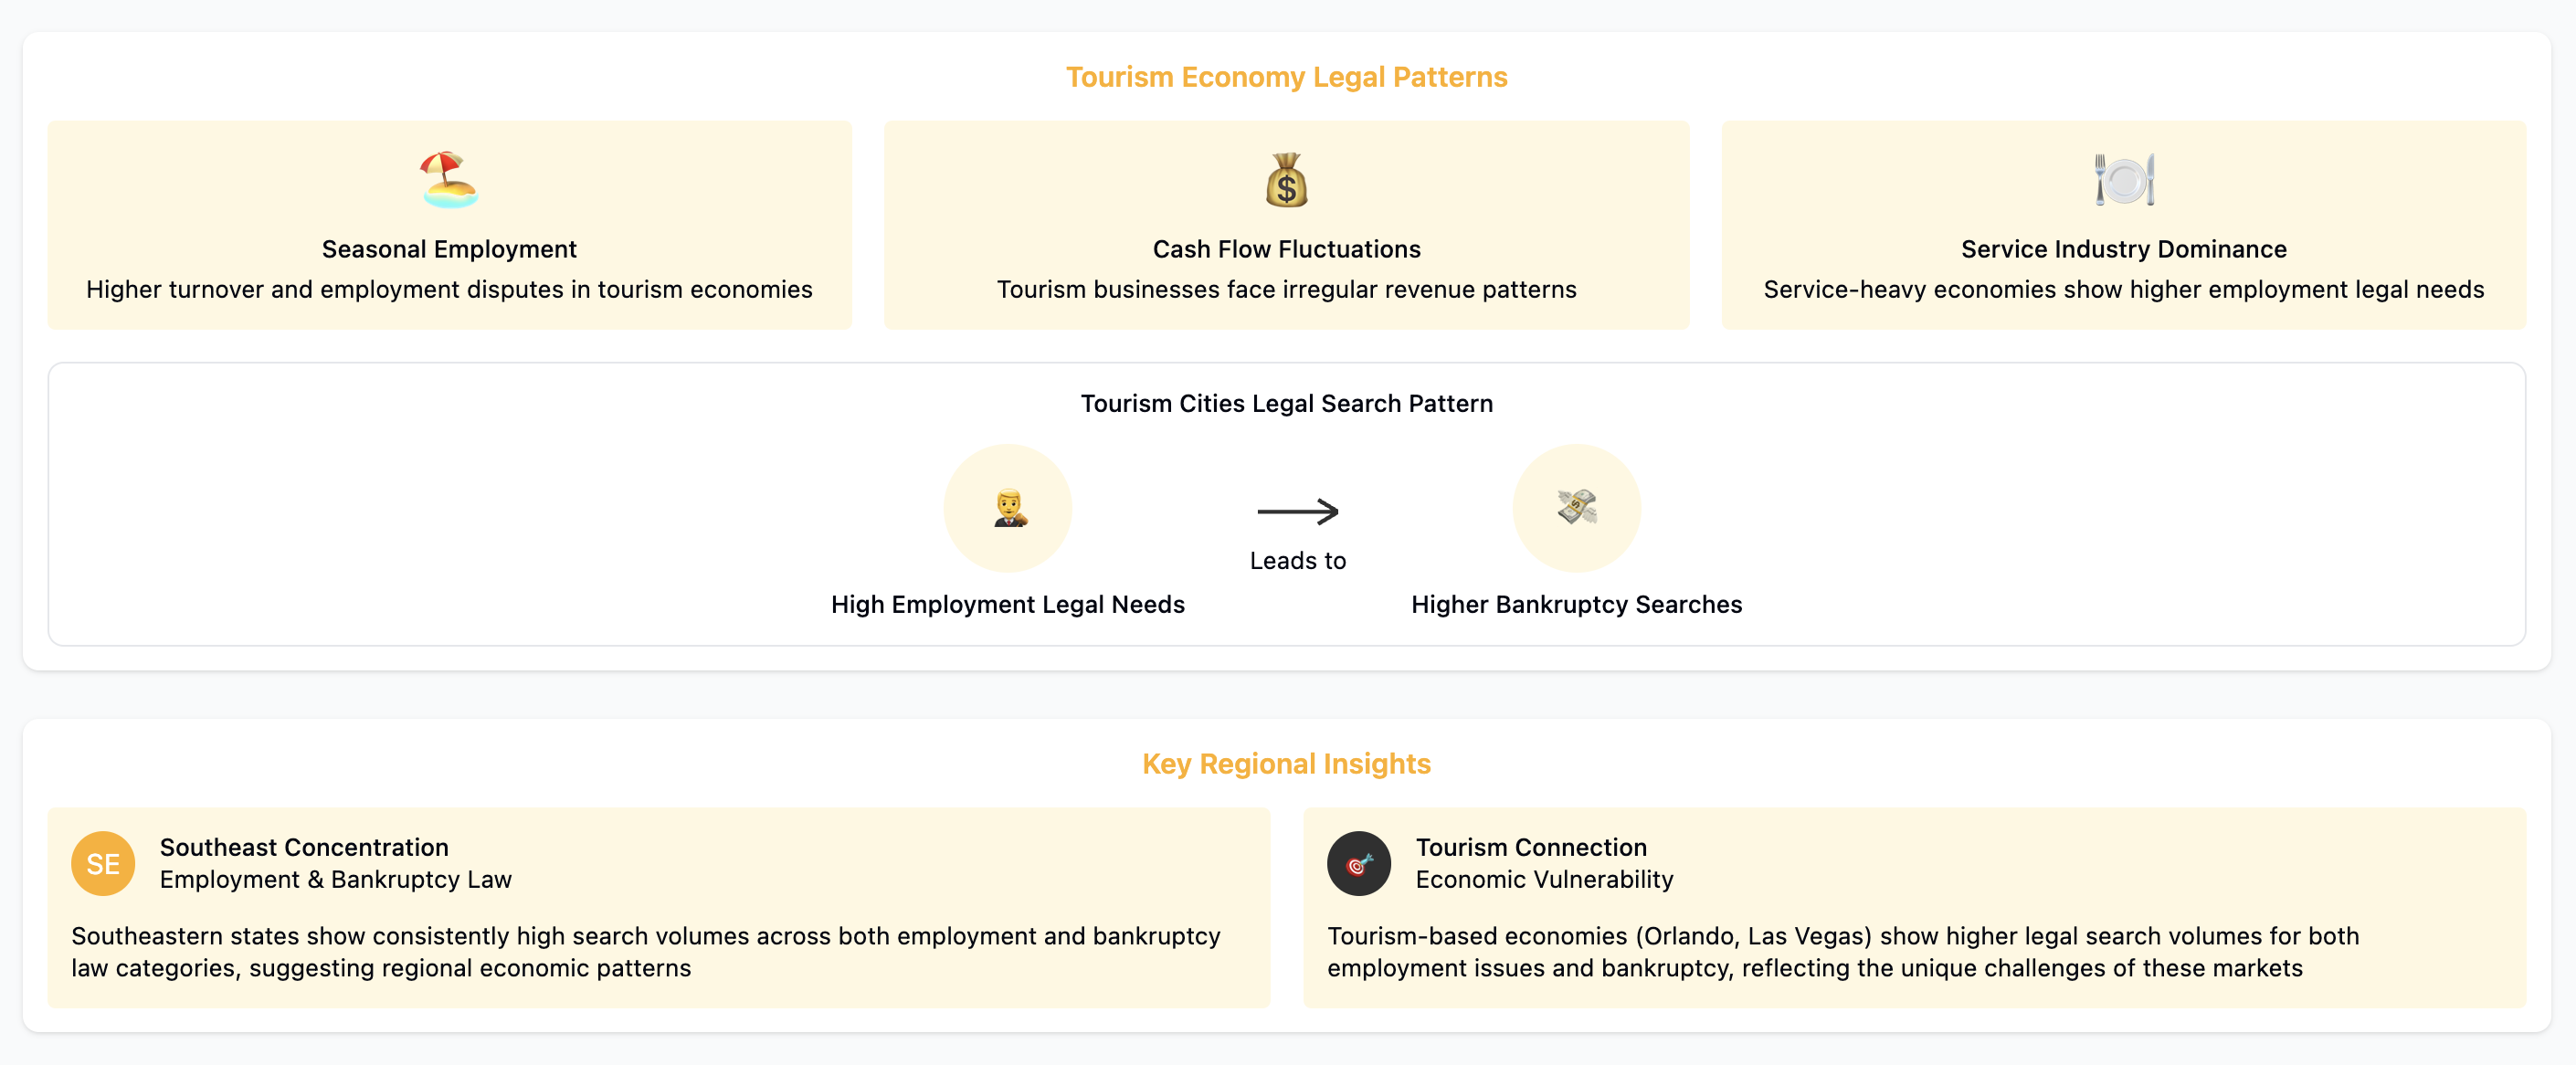
Legal search patterns can function as unofficial economic indicators across regions. Of course, several findings were unsurprising, while other results flagged significant issues that people need legal help with.
High bankruptcy rates in tourism hotspots, such as Orlando and Vegas, suggest a vulnerable economy in this sector. Adding to this, employment law searches in similar service-based economics could also indicate workplace issues that need resolving more regularly.
Immigration correlations between search interest and gateway cities like Miami confirm the region as a major travel hub for Latin America, although other Texas-based locations didn’t show up high on the list. A potential reflection of language or legal accessibility in the two district areas. Plus, surprising locations were served high on the list, such as Minneapolis, suggesting strong requirements for legal services in these non-traditional immigration hubs.
Accident economies emerged, particularly for personal injury legal support, Atlanta revealing itself as a hotspot in demand for personal injury lawyers.
DUI searches during the winter holiday season are not altogether unsurprising but draw attention to the need for seasonal prevention. For law firms, it’s important to be prepared for this serious requirement increase. As for family troubles, two snapshots reveal demand for services in January along with a regional “Divorce Belt” pattern emerging.
Recommendations for Legal Service Providers
For lawyers and law firms operating in a competitive sector, the report above delivers invaluable insight into the demand for specialist services. The findings can be used to tailor services based on the search for specific regions and seasons. It shows a number of strategic market opportunities:
Regional specialization: Clear regional variations offer opportunities for law firms to target specific services that meet the dominant demands in their region.
Seasonal Considerations: Resources can be managed to match predictable seasonal patterns to improve service delivery, while marketing efforts can be timed effectively.
Tourism Focus: Cities with a tourism-focused economy generally showed higher than average legal search volume across a number of categories with distinctive legal needs that need serving.
Underserved Populations: Law firms working in a saturated local market could consider expansion into regions or specialists with high search volumes in underserved locations.
Seasonal & Marketing Considerations
For law firms investing in marketing, the report highlights the importance of delivering campaigns in a timely fashion. Advertising budgets and content creations can be tailored based on the seasonal findings:
Bankruptcy Services in November-December to capture the year-end spike.
Divorce Services ramping up in December, ready for the January surge.
DUI Defense increased visibility in September-November to beat competitors to the holiday peak.
Keyword Focus: SEO strategies should target the specific legal terms most searched in each city.
Mobile Optimization: Tourist-heavy cities and services have a higher ratio of mobile device searches when looking for services.
Localized Landing Pages: Firms need to create city and specialty landing pages that address the legal requirements prominent in their market.
The authority of your website is becoming increasingly important for raising the profile of your business. Whether you want to rank highly on Google or be referenced by AI, you need authority. While getting backlinks can be challenging, there are platforms that make it easier for you. In this post, we review 10 of the […]
Scholarship Overview – University of Alberta Offered by: dNovo Group Value: $1,200 Deadline: 31 March 2026 Description – dNovo Scholarship Supporting Women in Law & Gender Equality The dNovo Group proudly presents the Women in Law Scholarship, an initiative designed to support women and gender-diverse students pursuing legal education at the University of Alberta. This […]
Toronto is home to numerous top SEO companies that offer diverse digital marketing expertise. In this comprehensive roundup, we profile some of the best SEO companies in Toronto, Canada. Whether you’re a business owner, marketing professional, or startup, you’ll find Toronto SEO experts here with ROI-focused SEO strategies to boost your Google rankings and drive […]
Best Digital Marketing Agencies in Toronto for 2026
Best Digital Marketing Agencies in Toronto: Quick Summary (2026) Are you in search of a top-performing digital marketing agency in Toronto? Whether you’re a law firm, SaaS brand, medical clinic, or local service provider, this guide breaks down the 10 best agencies based on performance, client reviews, specialization, and recognition for digital excellence. What Are […]